Most Amazon sellers can tell you their product’s price and their cost of goods. Fewer can tell you their actual net margin after every fee, every advertising dollar, and every operational cost is accounted for. Here is the complete unit economics model for a standard Amazon FBA product in 2026, with the numbers that most sellers either don’t know or don’t track.
The model product
Category: Home & Kitchen (15% referral fee). Selling price: $29.99. Size tier: Standard size, 12 oz. Landed COGS: $9.00 (including product cost, shipping to Amazon, customs if applicable). Average monthly sales: 300 units. Average return rate: 8%.
Revenue per unit sold
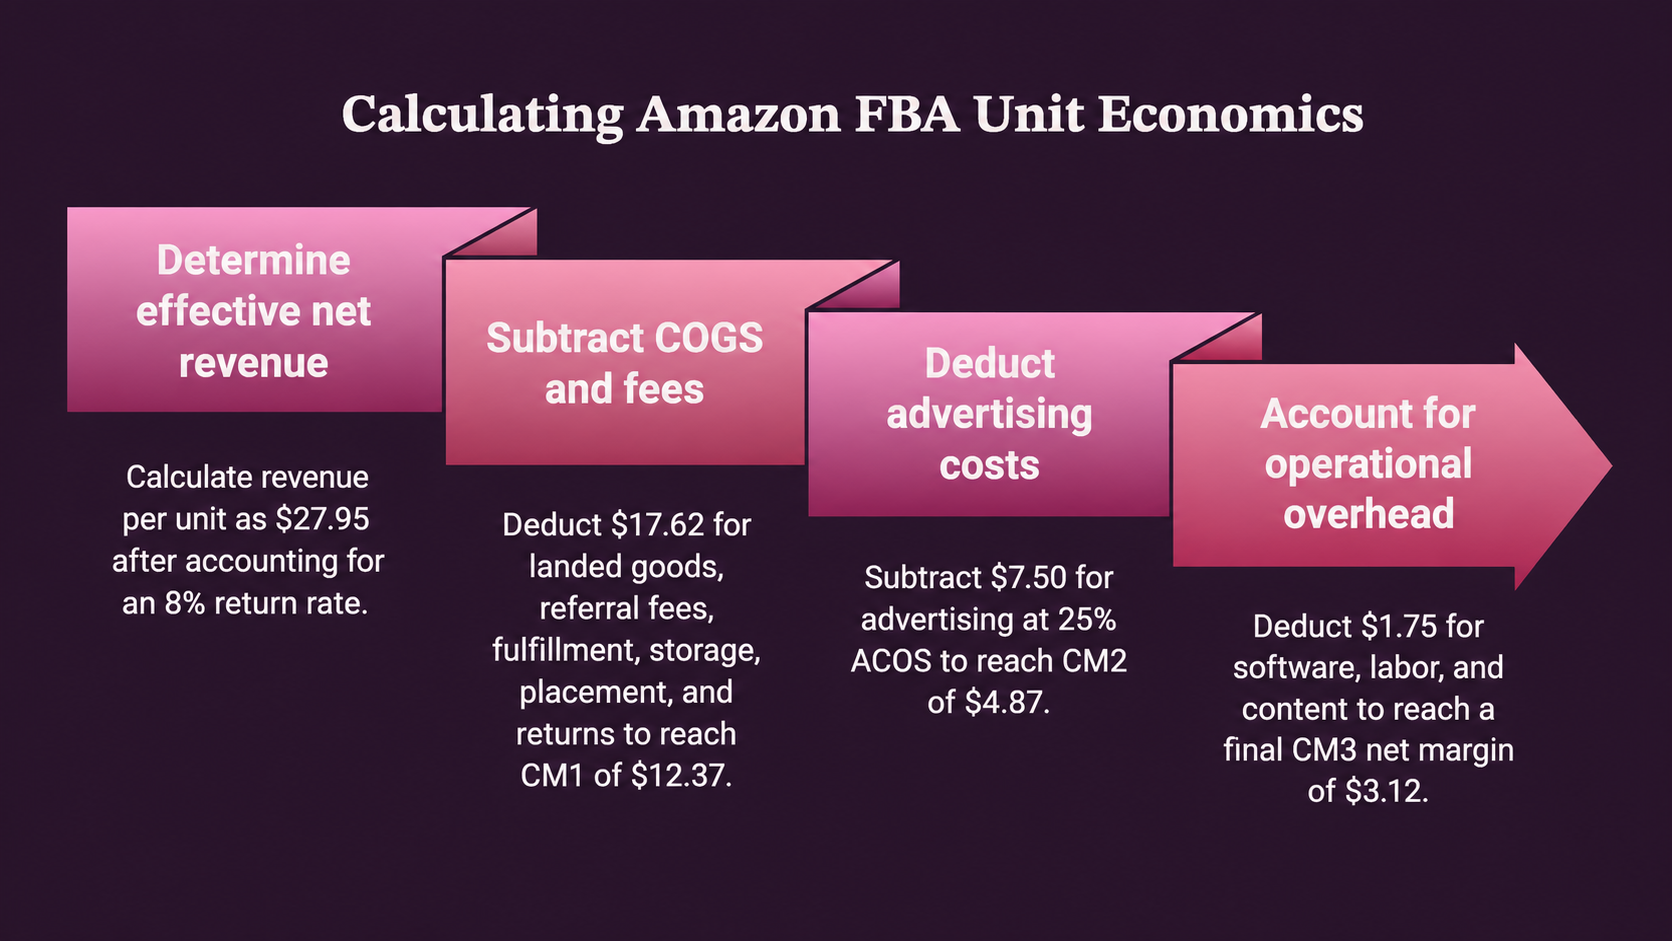
Gross revenue: $29.99. But not every unit sold stays sold. At an 8% return rate, for every 100 units sold, 8 are returned. The refund reduces net revenue per original sale. Accounting for returns: effective net revenue per unit = $29.99 x (1 - 0.08 x 0.85) = $29.99 x 0.932 = $27.95. (The 0.85 factor accounts for restocking fees Amazon retains on some returns and the fact that not all returns result in full refunds.)
Cost stack per unit
| Cost Component | Amount | % of $29.99 |
|---|---|---|
| Cost of goods (landed) | $9.00 | 30.0% |
| Amazon referral fee (15%) | $4.50 | 15.0% |
| FBA fulfillment fee | $3.22 | 10.7% |
| Monthly storage (amortized at standard rate) | $0.35 | 1.2% |
| Inbound placement service fee | $0.27 | 0.9% |
| Return processing (8% rate x $3.50) | $0.28 | 0.9% |
| Subtotal: COGS + Amazon fees | $17.62 | 58.8% |
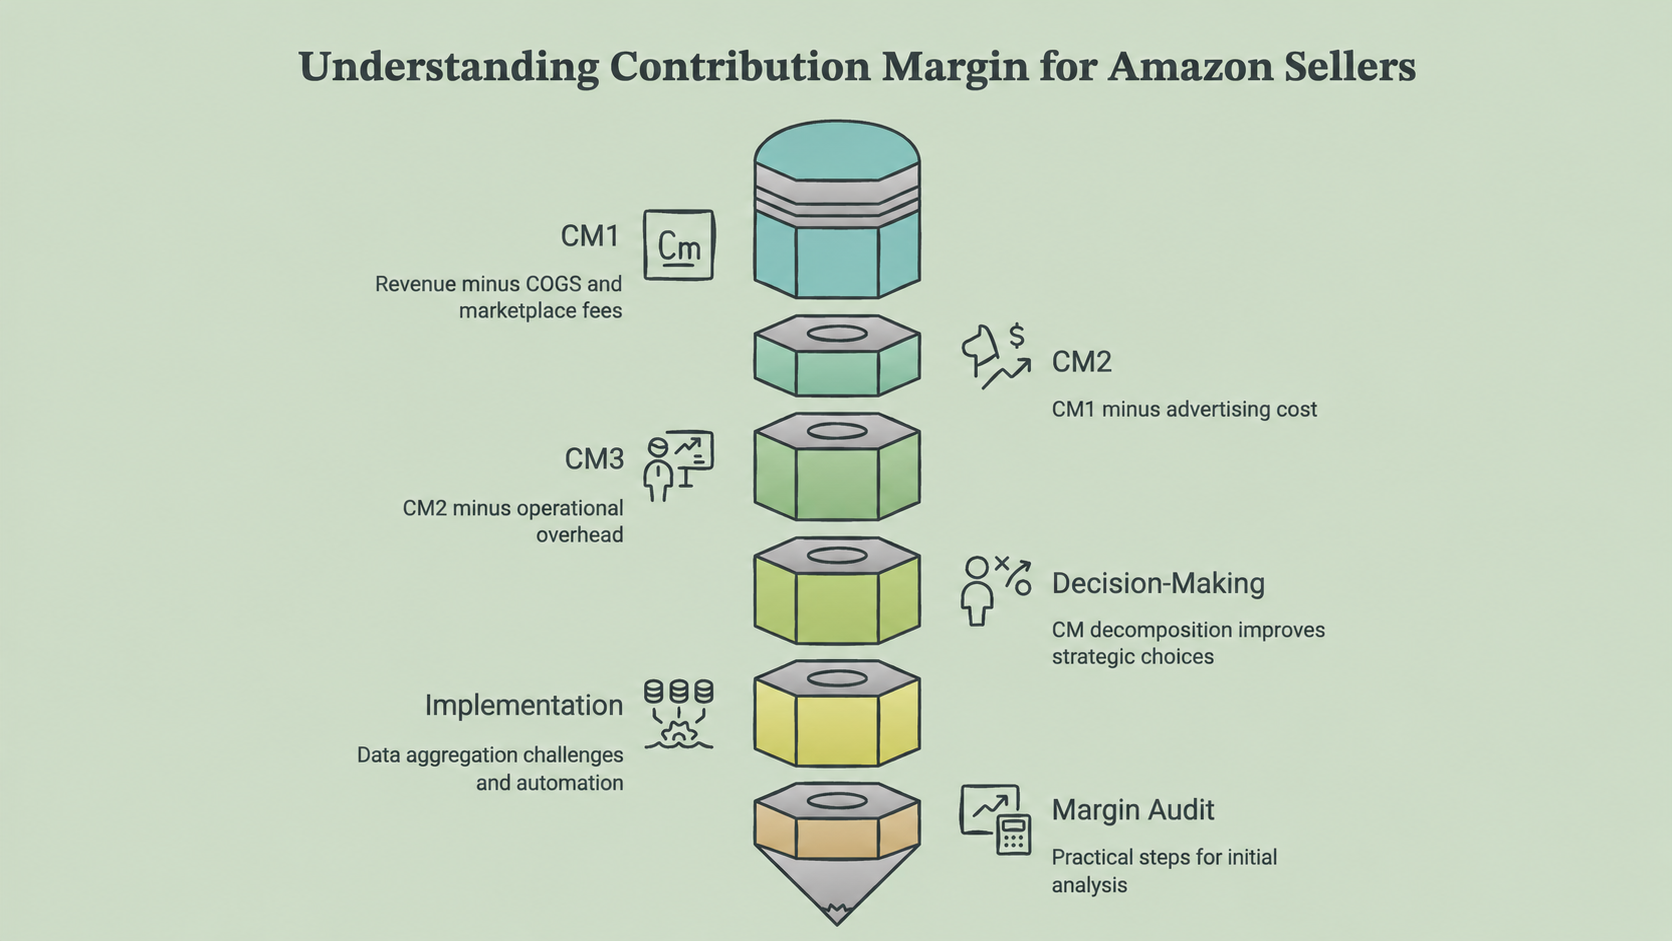
CM1 (Revenue minus COGS and fees): $29.99 - $17.62 = $12.37 (41.2%)
| Additional Cost | Amount | % of $29.99 |
|---|---|---|
| Advertising (25% ACOS on attributed sales) | $7.50 | 25.0% |
CM2 (CM1 minus advertising): $12.37 - $7.50 = $4.87 (16.2%)
| Operational Overhead | Amount | % of $29.99 |
|---|---|---|
| Software tools (amortized) | $0.40 | 1.3% |
| Labor allocation | $1.20 | 4.0% |
| Photography / content (amortized) | $0.15 | 0.5% |
CM3 (CM2 minus operational overhead): $4.87 - $1.75 = $3.12 (10.4%)
What the model reveals
At a $29.99 price point with industry-average costs, the seller earns $3.12 net margin per unit, 10.4% of the selling price. On 300 units per month, that’s $936 per month or $11,232 per year from this single ASIN.
But the model is sensitive to small changes in any variable.
If ACOS increases from 25% to 30% (a $1.50/unit increase), CM3 drops to $1.62 (5.4%), nearly halving profitability. If the return rate increases from 8% to 12% (common in some categories), effective revenue drops and return processing costs rise, reducing CM3 to approximately $2.20 (7.3%). If Amazon increases the referral fee by 1 percentage point (from 15% to 16%), CM3 drops by $0.30/unit, a 9.6% reduction in net margin.
Conversely, if the seller reduces ACOS from 25% to 20% through advertising optimization, CM3 increases to $4.62 (15.4%), a 48% improvement in profitability from a 5-point ACOS reduction.
The takeaway for sellers
Unit economics at this level of detail reveal where the most consequential improvements exist. Most sellers focus on revenue growth (selling more units). The model shows that advertising efficiency and fee management often have a larger impact on profitability than volume growth, because they affect every unit sold, not just incremental units.
Realify’s margin tracking provides this decomposition for every ASIN in your catalog, updated in real-time. When the system recommends a pricing change, an advertising adjustment, or an inventory rebalance, the recommendation is grounded in the actual unit economics, not the proxy metrics that most tools rely on.
- •[1] Fee calculations based on Amazon’s published 2026 fee schedule for standard-size FBA products.