Ask a seller what their revenue was last month, and they’ll tell you instantly. Ask what their margin was at the SKU level across all channels and most will pause. Some will open a spreadsheet. Many will admit they don’t have an answer they trust.
This isn’t a knowledge gap. It’s a tools gap. Amazon’s settlement reports show gross revenue minus fees. Advertising platforms show spend versus attributed revenue. Inventory tools show stock levels and cost of goods. But no standard seller tool constructs the complete picture: revenue minus all costs minus all fees minus advertising minus operational overhead at the individual SKU level.
This is the contribution margin framework, and implementing it changes how sellers make every material business decision.
The three layers of contribution margin
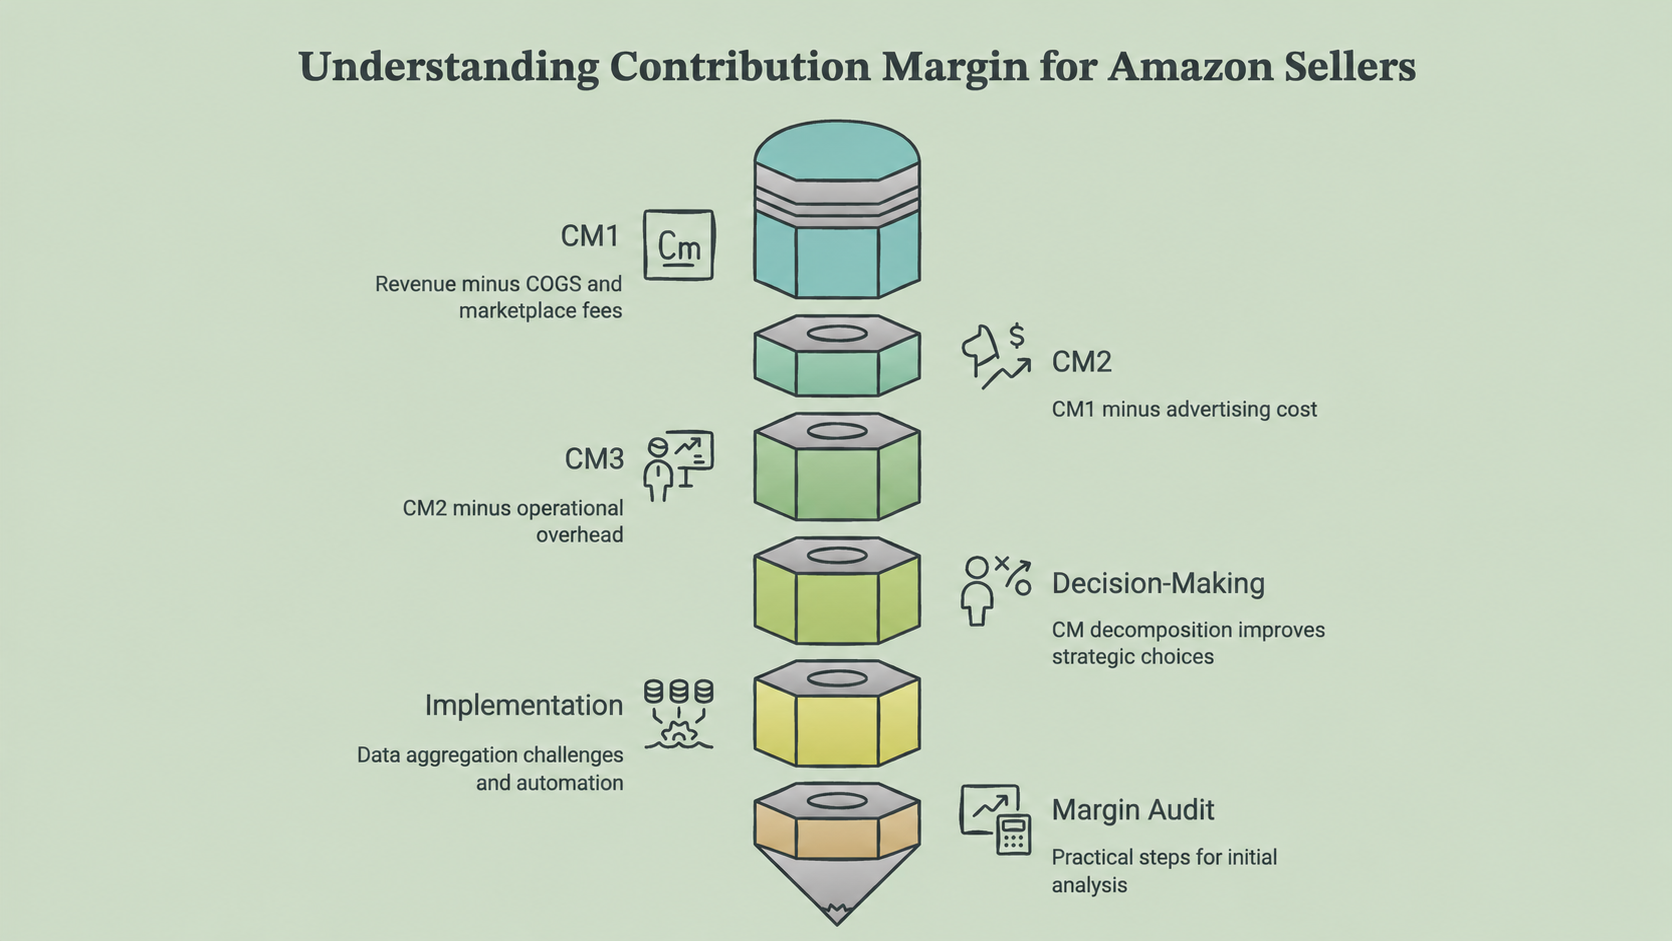
Contribution Margin 1 (CM1): Revenue minus Cost of Goods Sold minus marketplace fees. This is your product-level margin before advertising and operational costs. It answers the question: “Is this product inherently profitable on this channel?”
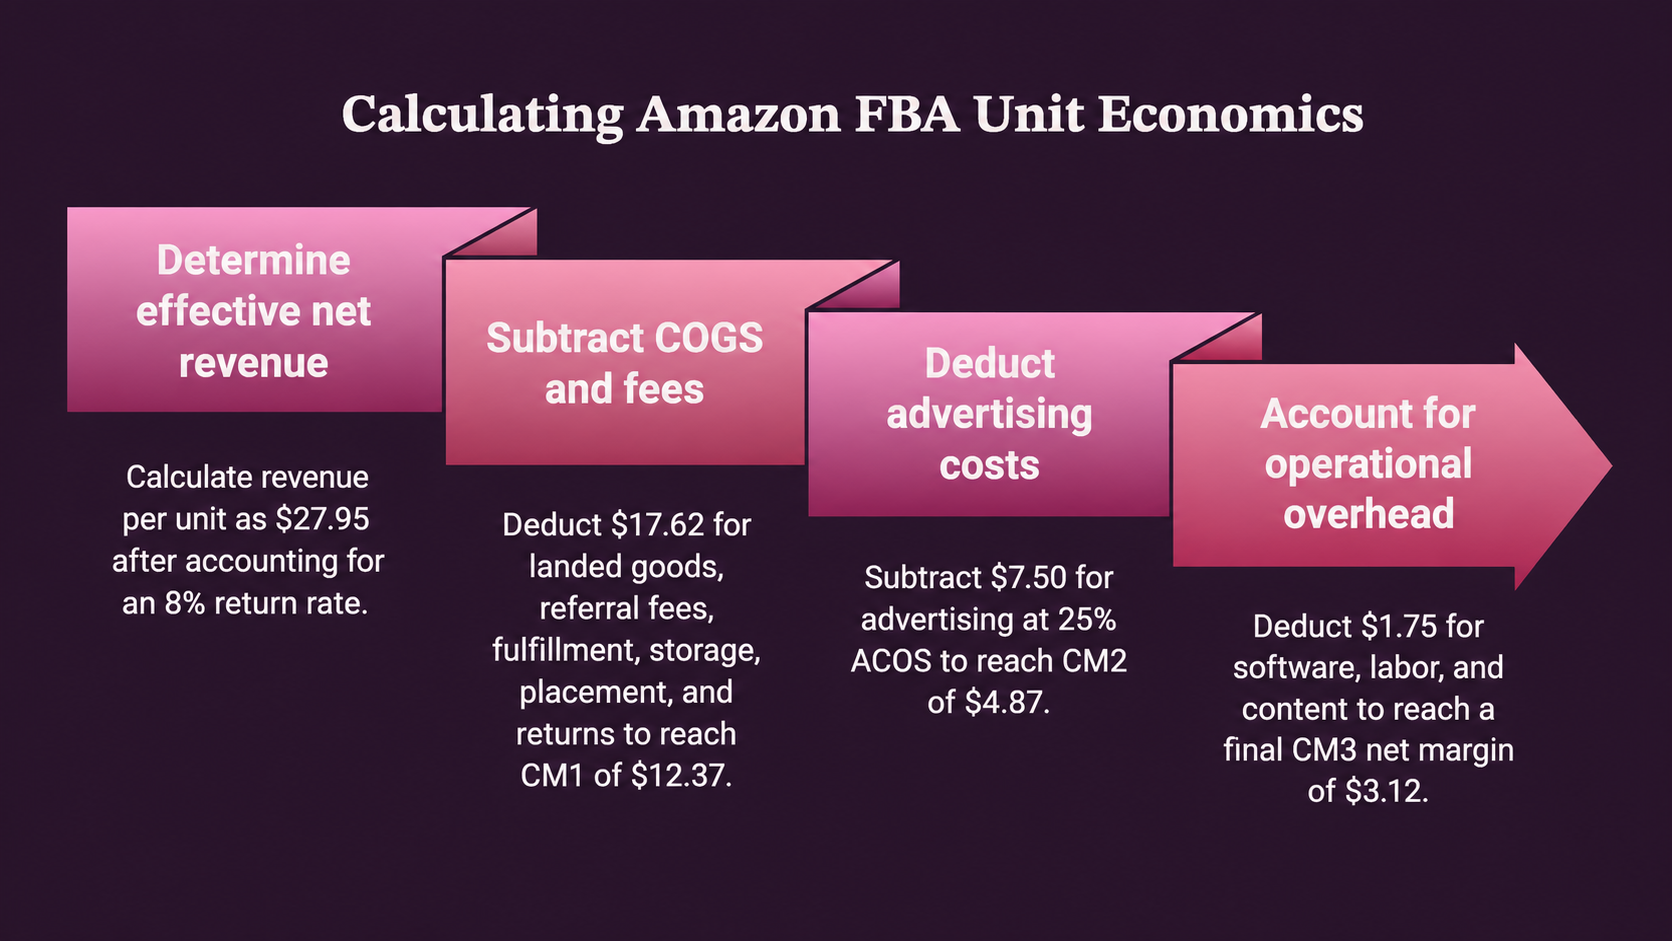
For a $29.99 Amazon product: $29.99 revenue, minus $9.00 COGS (30% landed cost), minus $4.50 referral fee (15%), minus $3.22 FBA fulfillment, minus $0.35 storage (amortized), minus $0.27 placement fee. CM1 = $12.65, or 42.2% of revenue [1].
Contribution Margin 2 (CM2): CM1 minus advertising cost. This answers: “Is this product profitable after the cost of acquiring the customer?”
Continuing the example: $12.65 CM1, minus $7.50 advertising cost (at 25% ACOS). CM2 = $5.15, or 17.2% of revenue.
Contribution Margin 3 (CM3): CM2 minus allocated operational overhead. This answers: “What does this product actually contribute to the business after all costs?”
Operational overhead includes: software subscriptions (allocated per SKU), labor (customer service, operations management), returns processing (net of Amazon reimbursements), and any other per-SKU variable costs. For a typical seller, this runs $1.50-$3.00 per unit. CM3 = $5.15 minus $2.00 = $3.15, or 10.5% of revenue.
Why CM decomposition changes decision-making
Without CM decomposition, sellers make decisions based on incomplete information. Consider four common scenarios.
Scenario 1: Should I increase advertising spend on this ASIN? Without CM2 visibility, a seller might increase spend on an ASIN with a “good” ACOS of 20%, not realizing that the product’s CM1 is only 25%, meaning the advertising cost is consuming 80% of the available margin. CM2 visibility reveals that this ASIN’s profitability is fragile. Any ACOS increase would push it into negative territory.
Scenario 2: Should I lower price to compete for the Buy Box? Without CM1 visibility at the proposed price, a seller might match a competitor’s aggressive pricing. CM1 at the lower price might reveal that the product drops below breakeven after fees, meaning every unit sold at the competitive price is a loss, regardless of advertising.
Scenario 3: Which products should I invest in for growth? Without CM3 across the catalog, a seller might invest growth capital in their highest-revenue ASINs. CM3 decomposition often reveals that high-revenue products have thin margins (because they require heavy advertising), while lower-revenue products have fat margins (because they convert organically). The highest-growth opportunity might be the low-revenue, high-CM3 product that would benefit from modest advertising investment.
Scenario 4: Which products should I sunset? Without CM3, sellers hold onto products based on revenue contribution. CM3 reveals which products are revenue-positive but profit-negative, consuming operational resources and advertising dollars that could be reallocated to genuinely profitable ASINs.
Implementing the CM framework
The mechanical challenge of CM decomposition is data aggregation. COGS data lives in your procurement system or spreadsheet. Fee data lives in Amazon’s settlement reports. Advertising data lives in your ad platform. Operational overhead lives in your accounting system. Constructing CM1, CM2, and CM3 requires pulling data from four or more sources and aligning it at the SKU level, a task that typically takes hours per week in a spreadsheet.
Realify automates this entirely. When you connect your Amazon account and input your COGS data, the system constructs CM1, CM2, and CM3 at the SKU level continuously. Not weekly. Not monthly. In real-time. When a fee changes, CM1 updates. When ACOS shifts, CM2 updates. When you adjust operational overhead assumptions, CM3 updates.
This continuous visibility means you’re always making decisions based on current economics, not last week’s spreadsheet. And when the system’s pricing, advertising, and inventory capabilities make recommendations, they’re grounded in the actual margin picture, not proxy metrics.
The margin audit you should do this week
If you’re not currently tracking CM1, CM2, and CM3, here’s a practical starting point. Pick your top 20 ASINs by revenue. For each, calculate: revenue per unit, COGS per unit, total Amazon fees per unit (referral + fulfillment + storage + any other fees from your settlement report), and advertising cost per unit (total ad spend on the ASIN divided by total units sold). Subtract these to get CM1 and CM2.
Most sellers who do this exercise for the first time discover at least 2-3 ASINs in their top 20 that are either unprofitable or barely profitable, subsidized by the performance of other products. That discovery alone is worth the exercise.
- •[1] Fee calculations based on Amazon’s published 2026 fee schedule. COGS and operational overhead based on industry averages for consumer products sellers.