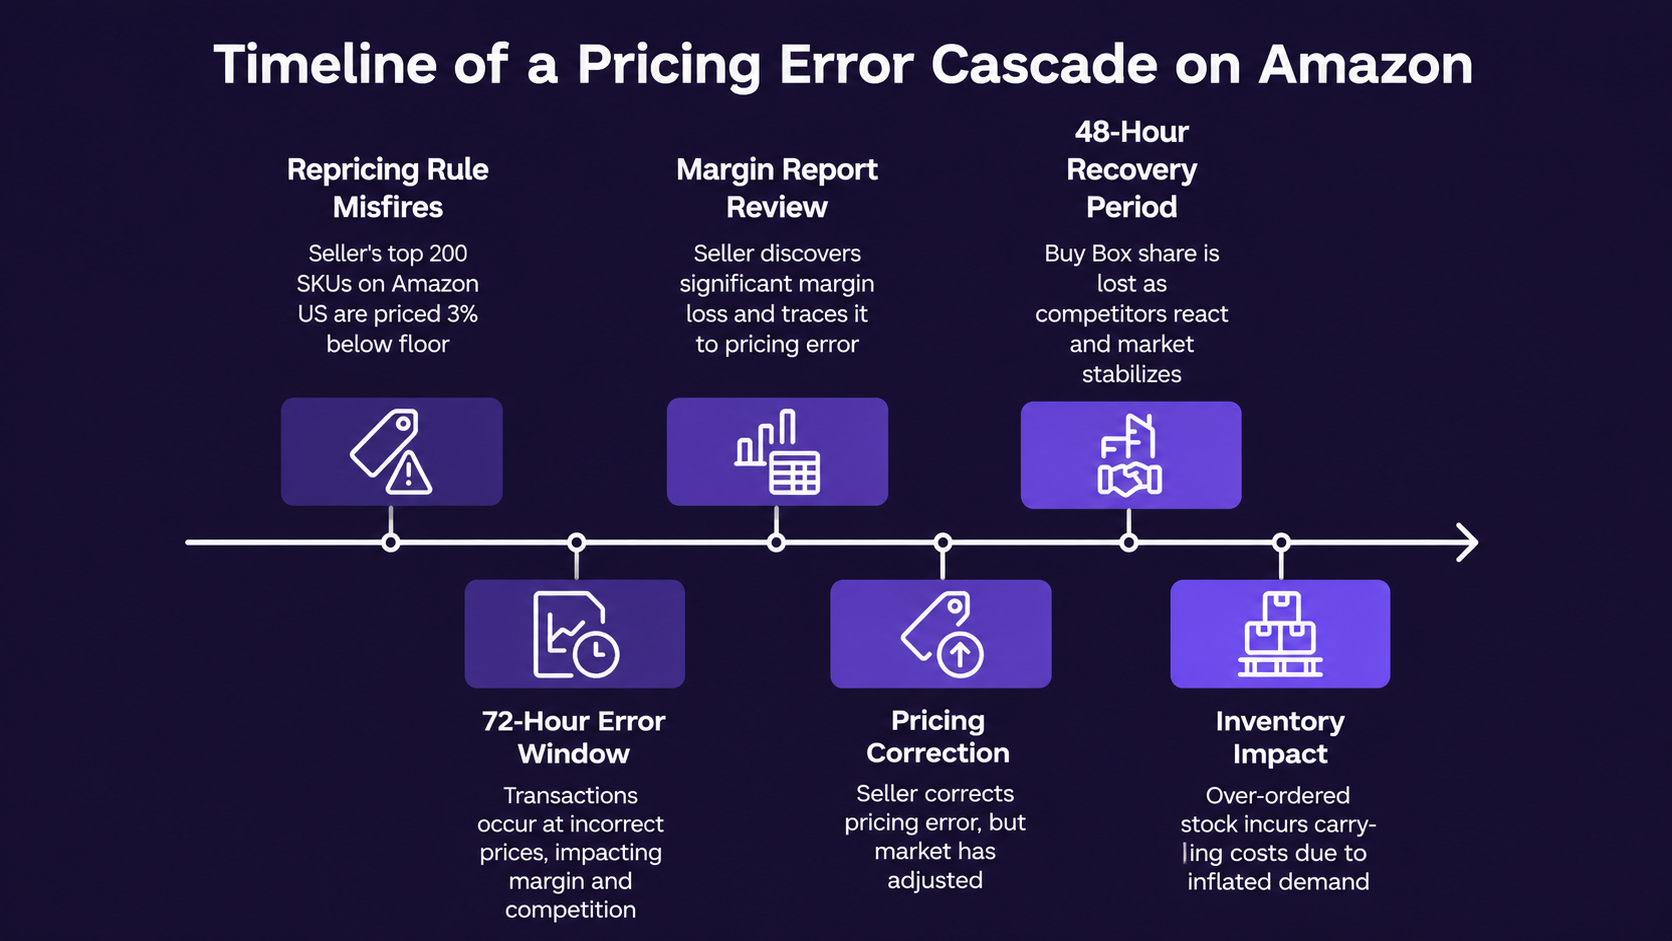
On a Tuesday evening, a repricing rule misfires. A seller’s top 200 SKUs on Amazon US are priced 3% below their intended floor. The error isn’t dramatic. No ASIN is priced at $0.01, so no alarm triggers. The repricing tool shows a healthy Buy Box win rate. The advertising dashboard shows improving click-through rates. Everything looks fine.
Seventy-two hours later, on Friday morning, the seller reviews their weekly margin report in a spreadsheet and realizes something is wrong. Revenue is up slightly. Margin is down significantly. They trace the cause to the pricing error, but by now, 72 hours of transactions have already settled at the wrong price.
Here is the math on what those 72 hours actually cost.
Direct margin loss
Assume the 200 affected SKUs have an average selling price of $34.99 and an average daily sell-through of 3 units per SKU. A 3% pricing error means each unit sold for approximately $1.05 less than intended.
Over 72 hours: 200 SKUs x 3 units/day x 3 days x $1.05 = $1,890 in direct margin loss.
For a seller doing $3M annually, $1,890 over three days might seem tolerable. But this is only the first-order effect.
Competitive repricing cascade
When you lower your price, even unintentionally, competitors’ repricing tools respond. Some match. Others undercut. The competitive price point for your category shifts downward. When you correct your pricing error on Friday, you’re now repricing into a market that has adjusted to your lower price point. Returning to your original price means losing Buy Box share until competitors’ tools recalibrate, which can take another 24 to 72 hours [1].
The cascade effect roughly doubles the initial margin impact. Conservative estimate for the recovery period: another $1,200 to $1,800 in margin erosion during the 48 hours it takes the market to restabilize.
Advertising waste
During the 72-hour error window, your advertising campaigns continued driving traffic to the underpriced listings. If your average ACOS is 25%, you were spending $0.26 in advertising for every dollar of (reduced) revenue. But the advertising was optimized for the original price point, the click bids, keyword targets, and budget allocations assumed a higher margin per conversion.
Estimated advertising waste during the error window: $400 to $700, depending on campaign structure and daily spend. The advertising tool had no way to know the margin equation had changed because it operates independently of the pricing tool.
Inventory velocity distortion
Lower prices drove higher velocity. Your inventory tool, seeing the elevated sell-through, may have triggered a reorder at quantities calibrated to the artificially inflated demand. If the reorder threshold was hit during the 72-hour window, you’ve now committed working capital to replenish stock at a velocity that won’t persist once prices correct.
Estimated excess inventory cost (carrying costs on over-ordered stock): $300 to $600 over the subsequent 30-day period.
Total impact
Adding the direct, cascade, advertising, and inventory effects: a 3% pricing error running for 72 hours on 200 SKUs costs between $3,800 and $5,000, roughly 2.5 to 3.5 times the direct margin loss.
And this is a mild example. A 5% error, or an error affecting higher-priced ASINs, or an error running for a full week before detection, compounds these figures dramatically.
Why detection takes so long
The seller in this scenario didn’t detect the error for 72 hours. That isn’t negligence. It’s a structural limitation of the fragmented tool stack. The repricing tool showed a healthy Buy Box win rate (because lower prices win more Buy Boxes). The advertising dashboard showed improving click-through rates (because lower prices attract more clicks). The inventory tool showed healthy velocity (because lower prices drive more sales). Every individual tool reported positive signals. The error was only visible in the blended margin view, which lived in a spreadsheet updated weekly [2].
What detection should look like
Realify’s approach to this problem is fundamentally different from a repricing tool that monitors price compliance. Because Realify sees pricing, advertising, inventory, and margin in one system, it detects anomalies that no individual tool can identify.
When a pricing change causes margin to deviate from your defined target, Realify flags it immediately, not in a weekly report, but in real-time. It also evaluates downstream effects: has the price change altered advertising ROI? Has it affected inventory velocity projections? Is the competitive landscape responding in a way that changes the optimal recovery strategy?
The goal isn’t just to catch errors faster. It’s to prevent the cascade of second-order effects that turn a $1,890 pricing mistake into a $5,000 operational loss.
- •[1] Competitive repricing dynamics documented in Buy Box research by Feedvisor, 2024-2025.
- •[2] Amazon Seller Central Forums, pricing and promotion errors identified as top-5 seller challenge, December 2025.