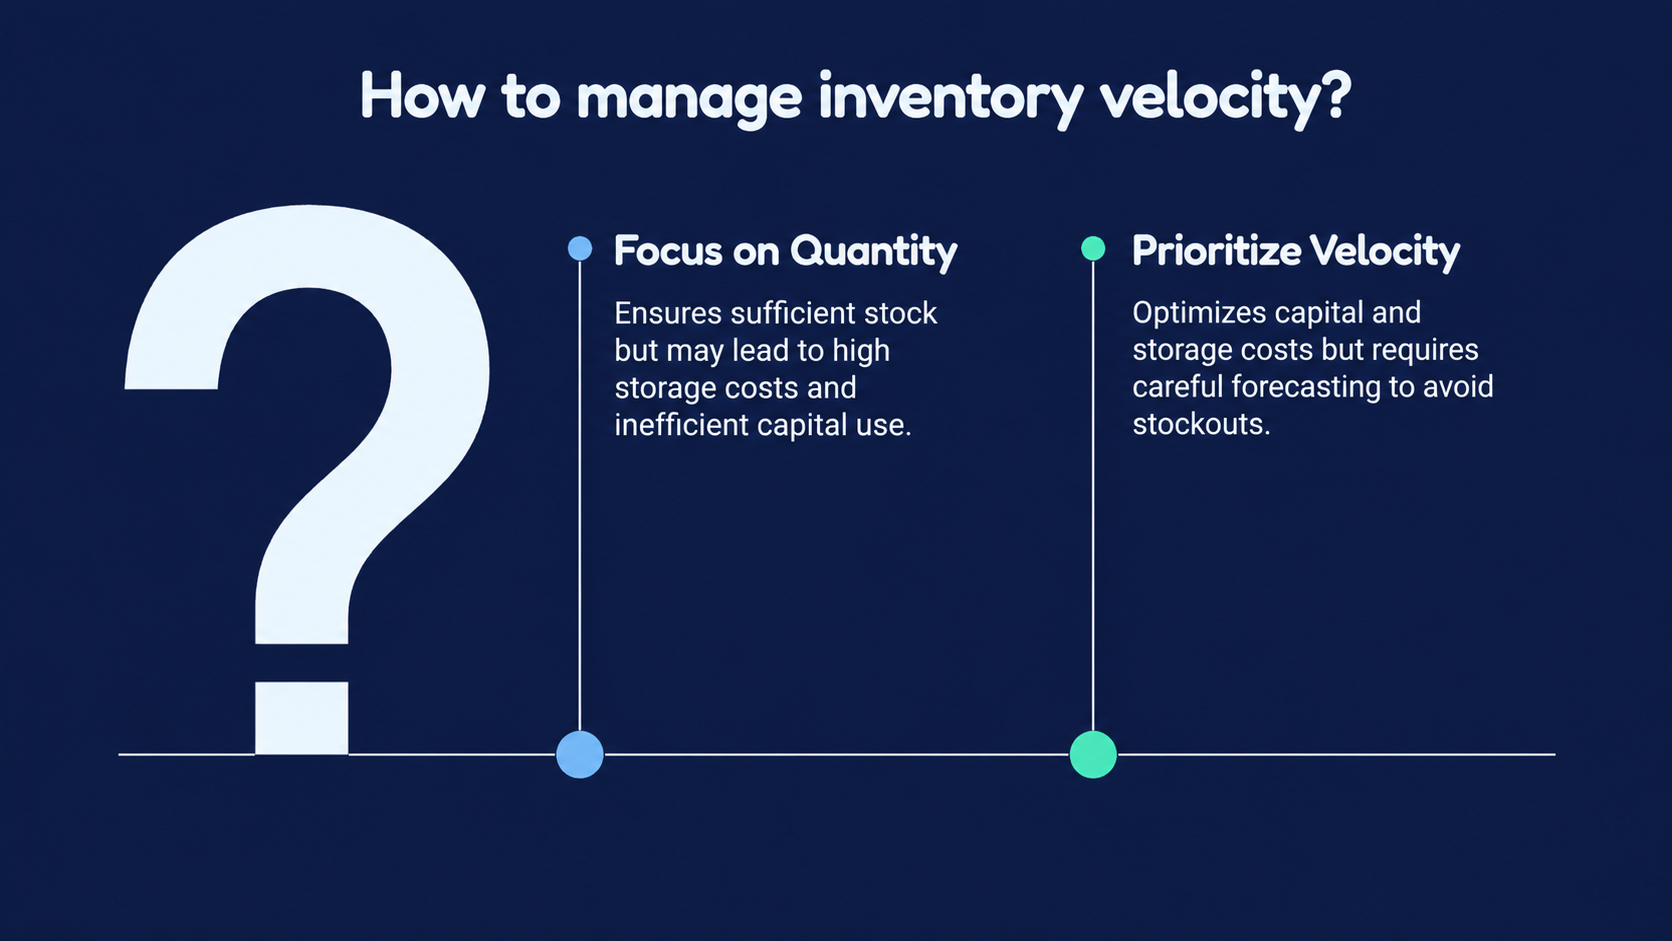
There are two ways to think about inventory. The first, and the way most sellers think about it, is quantity: how much do I have? The second, and far more useful way, is velocity: how fast is it moving?
Inventory quantity tells you whether you’ll stock out. Inventory velocity tells you whether your capital is working efficiently, whether your storage costs are optimized, whether your reorder timing is right, and whether your pricing strategy is aligned with demand.
What velocity tells you that quantity doesn’t
A seller with 500 units in FBA might feel comfortable. But comfort depends entirely on context. If those 500 units sell at 25 per day, that’s 20 days of coverage, tight, with reorder lead times of 14-21 days for most suppliers. If those same 500 units sell at 5 per day, that’s 100 days of coverage, meaning 80 days of excess inventory incurring storage fees, with aged inventory surcharges approaching if velocity doesn’t improve.
Velocity converts inventory from a static number into a rate, and rates are what matter for decision-making [1].
The IPI (Inventory Performance Index) that Amazon uses to determine your restock limits and storage capacity is fundamentally a velocity-based metric. Amazon rewards sellers who turn inventory quickly and penalizes those who don’t. A high-velocity seller gets more storage capacity and lower effective storage costs. A low-velocity seller faces restock limits and surcharges.
The velocity-pricing connection
Here’s where velocity becomes strategically powerful: it connects inventory decisions to pricing decisions.
A seller with excess inventory on an ASIN has two options. Option one: hold price and accept the ongoing storage costs, hoping demand recovers. Option two: reduce price to accelerate velocity, accepting lower margin per unit but reducing total storage cost and freeing capital for better-performing SKUs.
The right answer depends on the math, specifically, whether the storage cost of holding exceeds the margin sacrifice of marking down. For a product with $2.40/cubic foot Q4 storage rates and a declining velocity trend, the breakeven calculation often favors markdown earlier than sellers expect.
Most sellers make this decision with incomplete information because their pricing tool doesn’t see storage costs and their inventory tool doesn’t see margin. The decision gets delayed until the aged inventory surcharge forces action, by which point the optimal markdown window has passed.
Forecasting velocity, not just tracking it
Tracking current velocity is useful. Forecasting future velocity is transformative. Velocity changes in response to seasonality, competitive shifts, advertising investment, and external factors. A seller who knows that their product’s velocity historically drops 30% in February can pre-position inventory levels accordingly, ordering less in December rather than discovering excess stock in March.
Realify’s demand forecasting capability generates velocity projections that factor in seasonal patterns, competitive activity, advertising performance, and category-level trends. These projections feed directly into inventory recommendations: when to reorder, how much to order, and how to allocate across fulfillment channels.
The result is a shift from reactive inventory management (checking levels and reordering when they’re low) to proactive inventory optimization (maintaining the velocity profile that maximizes margin while minimizing storage cost and stockout risk).
- •[1] Amazon IPI (Inventory Performance Index) documentation and seller community analysis of IPI score factors, 2025.