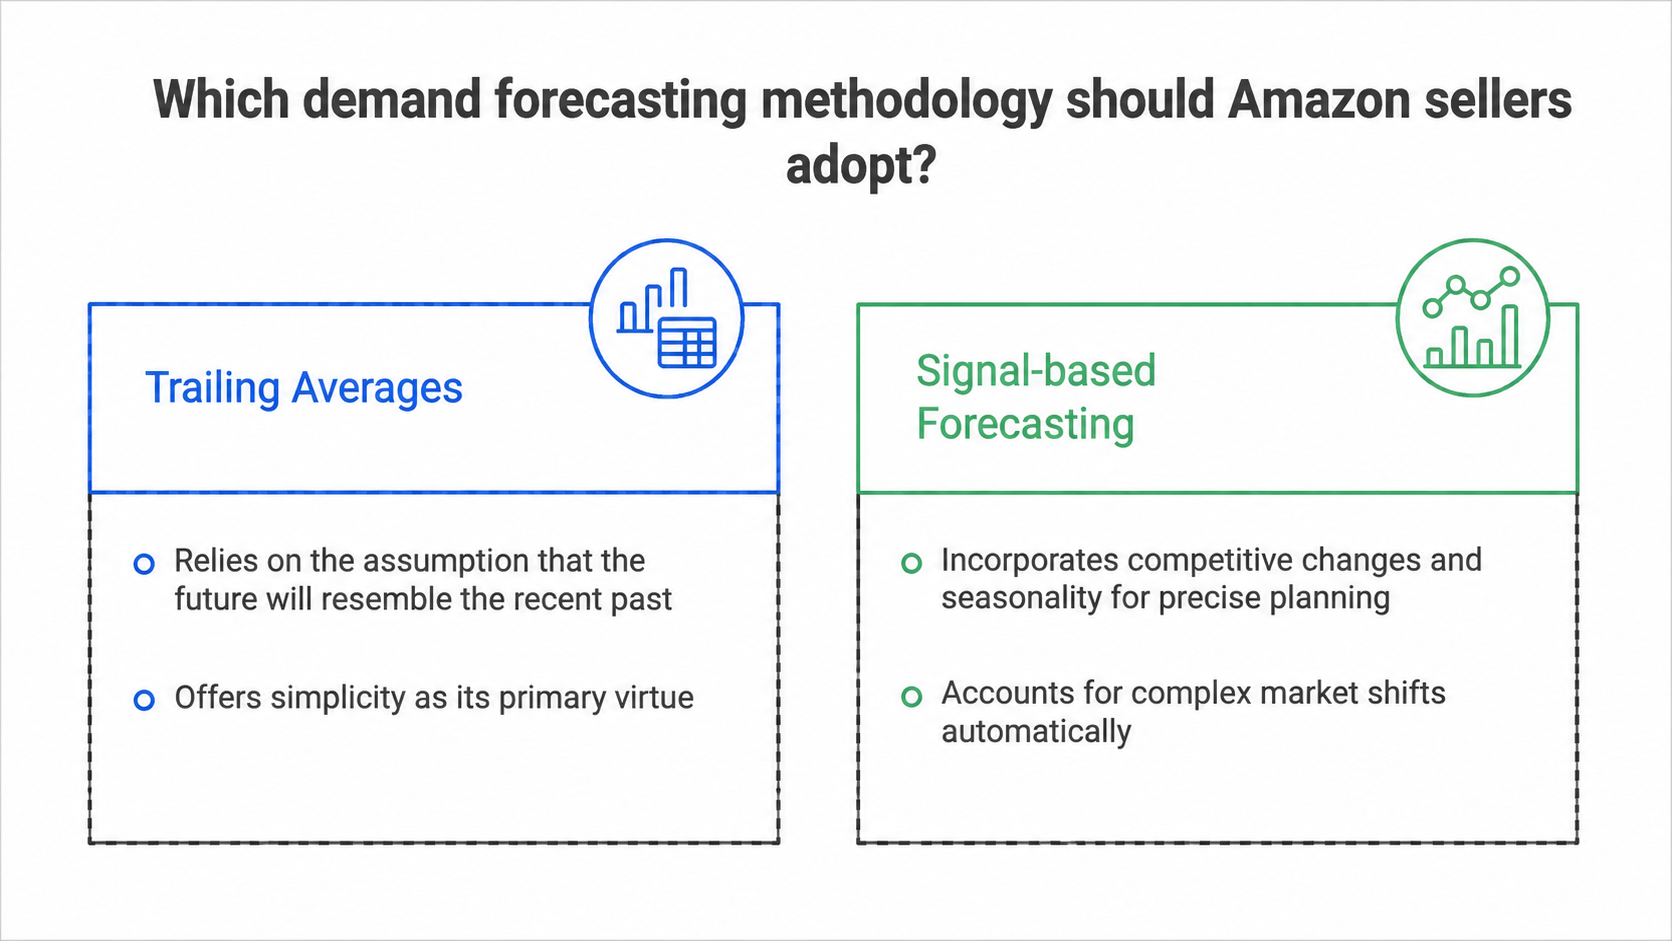
The most common demand forecasting method among Amazon sellers is also the least reliable: a trailing average of the last 30, 60, or 90 days of sales, calculated in a spreadsheet.
This approach has one virtue, simplicity, and several fatal flaws. It assumes the future will resemble the recent past. It can’t account for seasonality unless the seller manually adjusts. It doesn’t incorporate competitive changes (a new entrant or a competitor stockout can shift demand dramatically). And it provides a single point estimate when what the seller actually needs is a range with confidence intervals.
For a seller doing $500K to $10M annually, forecasting errors compound into five-figure and six-figure consequences over the course of a year [1].
Why trailing averages fail
Trailing averages smooth out the very signals that matter most for forecasting.
If your product’s daily sales were: 20, 22, 18, 21, 19, 20, 45, 42, 48, 44, the trailing average shows a gentle upward trend. But a human looking at this sequence sees a clear regime change around day 7. Something happened, a competitor stocked out, a seasonal trend kicked in, an influencer mentioned the product, or an advertising campaign started converting. The trailing average incorporates this signal slowly, taking 2-3 weeks to fully reflect the new demand level. By then, you’ve either stocked out (if the surge was real) or over-ordered (if it was a temporary spike).
Signal-based forecasting
Signal-based forecasting starts with the same historical sales data but layers in additional signals that predict demand changes before they fully manifest in sales figures.
Search volume trends: Amazon search volume for your primary keywords is a leading indicator of demand. When search volume increases for “wireless headphones noise cancelling,” demand for products in that category will follow within days. Monitoring search volume gives you 3-7 days of advance signal.
Competitive inventory signals: when a major competitor approaches stockout, their reduced availability redirects demand to remaining sellers. Detecting competitor inventory decline (through listing monitoring and buy box rotation patterns) signals a demand surge 3-10 days before it hits your sales data.
Advertising response signals: changes in your advertising click-through rate and conversion rate, independent of spend changes, indicate shifts in shopper intent. Rising CTR at the same bid level suggests increasing demand.
External signals: weather (seasonal products), cultural events, social media trends, and macroeconomic indicators all affect demand patterns. A seller of portable fans doesn’t need to wait for sales data to know that a heat wave forecast means demand will spike.
Category-level velocity: aggregate sales velocity across all sellers in your category provides a context that individual product data can’t. If category velocity is increasing but your velocity is flat, you’re likely losing share, a competitive signal. If your velocity is increasing faster than the category, you’re gaining share, a positive signal.
How Realify forecasts demand
Realify’s forecasting capability ingests all of these signal types and generates demand projections that update continuously. These projections aren’t single numbers. They’re probability distributions that express the range of likely outcomes. “We project 25-35 units/day over the next 14 days with 80% confidence” is more useful than “we project 30 units/day” because it allows the seller to plan for the range rather than betting on a point estimate.
These forecasts feed directly into inventory recommendations (when to reorder and how much), pricing intelligence (should you raise price to manage demand against limited inventory?), and advertising optimization (should you increase spend to capitalize on rising demand or throttle back to match inventory constraints?).
The shift from spreadsheet-based trailing averages to signal-based forecasting isn’t incremental. It’s structural. It changes the seller from reactive (discovering demand changes in historical data) to proactive (anticipating demand changes from leading signals). And in a marketplace where stockouts and overstock both carry five-figure costs, the difference between reactive and proactive forecasting is a direct margin impact.
- •[1] Inventory mismanagement and forecasting error costs documented in Forbes analysis of FBA seller challenges, 2025.